
D3入门学习
发表于 阅读时长9分钟
目录
学习的是最新的v5版本,api区别于v3。
本次学习主要通过完成一个简单的力导向图, 来学习d3部分api的使用。
前提
安装d3
npm install d3 --save
引用d3
import * as d3 from 'd3';
模拟数据
const nodes = [{
        id: 1,
        name: "a"
    },
    {
        id: 2,
        name: "b"
    },
    {
        id: 3,
        name: "c"
    }
];
const edges = [{
        id: 1,
        source: 1,
        target: 2,
        tag: "ab"
    },
    {
        id: 2,
        source: 1,
        target: 3,
        tag: "ac"
    },
    {
        id: 3,
        source: 2,
        target: 3,
        tag: "bc"
    },
    {
        id: 4,
        source: 3,
        target: 2,
        tag: "cb"
    }
];
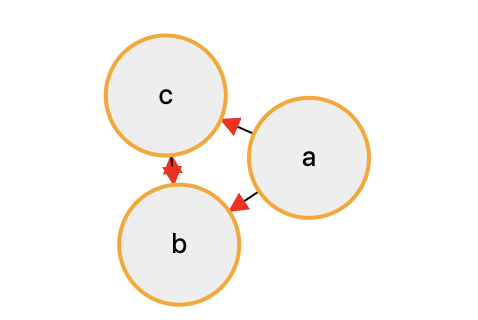
我们先简单的构造三个点和四条边的数据
模型
const simulation = d3
    .forceSimulation(nodes)
    .force("link", d3.forceLink(edges).id(d => d.id))
    .force("collision", d3.forceCollide(1))
    .force("center", d3.forceCenter(600, 400))
    .force(
        "charge",
        d3
        .forceManyBody()
        .strength(-1000)
        .distanceMax(800)
    );
添加svg
因为这些图形是使用svg画的,需要先添加svg。选择指定的div,添加svg
const svg = d3
    .select("#container")
    .append("svg")
    .attr("width", 1200)
    .attr("height", 800)
添加g
g是svg中的一个元素,是用于管理子元素的容器。我们可以把一些相同类型的元素放到同一个g中。
为svg添加g
const g = svg.append('g');
添加节点
添加节点
const nodeCircle = svg
    .select('g')
    .selectAll('circle')
    .data(nodes)
    .enter()
    .append('circle')
    .attr('r', 30)
    .style('fill', '#eee')
    .style('stroke', '#ffa500')
    .style('stroke-width', 2);
添加节点文字
const nodeText = svg
    .select('g')
    .selectAll('text')
    .data(nodes)
    .enter()
    .append('text')
    .attr('dy', '.3em')
    .attr('text-anchor', 'middle')
    .style('fill', '#000')
    .text(d => d.name)
添加线
const edgeLine = svg
    .select("g")
    .selectAll("line")
    .data(edges)
    .enter()
    .append("path")
    .attr("d", d => {
        return (
            d &&
            "M " +
            d.source.x +
            " " +
            d.source.y +
            " L " +
            d.target.x +
            " " +
            d.target.y
        );
    })
    .attr("id", (d, i) => {
        return "edgepath" + i;
    })
    .attr("marker-end", "url(#arrow)") // id为arrow的元素
    .style("stroke", "#000")
    .style("stroke-width", 1);
添加箭头
const defs = g.append("defs");
记住这个defs,后续还会使用
const arrowHead = defs
    .append("marker")
    .attr("id", "arrow")
    .attr("markerUnits", "userSpaceOnUse")
    .attr("class", "arrowhead")
    .attr("markerWidth", 20)
    .attr("markerHeight", 20)
    .attr("viewBox", "0 0 20 20")
    .attr("refX", 9.3 + 30)
    .attr("refY", 5)
    .attr("orient", "auto");
arrowHead
    .append("path")
    .attr("d", "M0,0 L0,10 L10,5 z")
    .attr("fill", "#f00");
重新定位位置
重新定位节点和节点文字和线的位置
simulation.on('tick', () => {
    nodeCircle.attr('transform', d => {
        return d && "translate(" + d.x + "," + d.y + ")"
    });

    nodeText.attr("transform", d => {
        return "translate(" + d.x + "," + d.y + ")";
    });
    edgeLine.attr("d", d => {
        const path =
            "M " +
            d.source.x +
            " " +
            d.source.y +
            " L " +
            d.target.x +
            " " +
            d.target.y;
        return path;
    });
})
svg的渲染顺序
按照上面步骤,我们发现,线直接覆盖在了圆上。这是因为svg的图层显示是严格按照定义元素的顺序来渲染的。它在z轴的显示顺序不能像html通过设置z-index来调整,只能通过定义元素先后出现的顺序来调整。
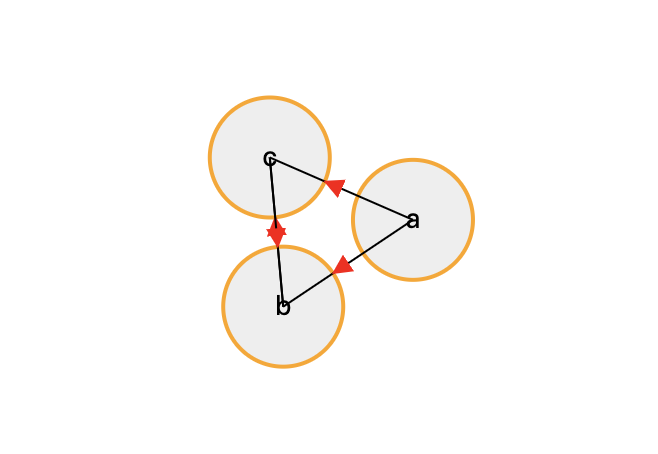
我们上面的例子是先定义了节点的svg元素,再定义线的。所以我们调整添加线和圆的实现顺序。
后续完善例子的时候还会遇到类似问题。
添加缩放
const svg = d3
    .select("#container")
    .append("svg")
    .attr("width", 1200)
    .attr("height", 800)

*     .call(zoom);
function onZoomStart(d) {
    // console.log('start zoom');
}

function zooming(d) {
    // 缩放和拖拽整个g
    g.attr("transform", d3.event.transform); // 获取g的缩放系数和平移的坐标值。
}

function onZoomEnd() {
    // console.log('zoom end');
}
const zoom = d3
    .zoom()
    .scaleExtent([1 / 10, 10]) // 设置最大缩放比例
    .on("start", onZoomStart)
    .on("zoom", zooming)
    .on("end", onZoomEnd);
注意声明函数的位置,避免出现调用时来未声明的错误。
调整距离
d3.forceLink(edges)
	.id(d => d.id)

* .distance(200)
调整测试数据
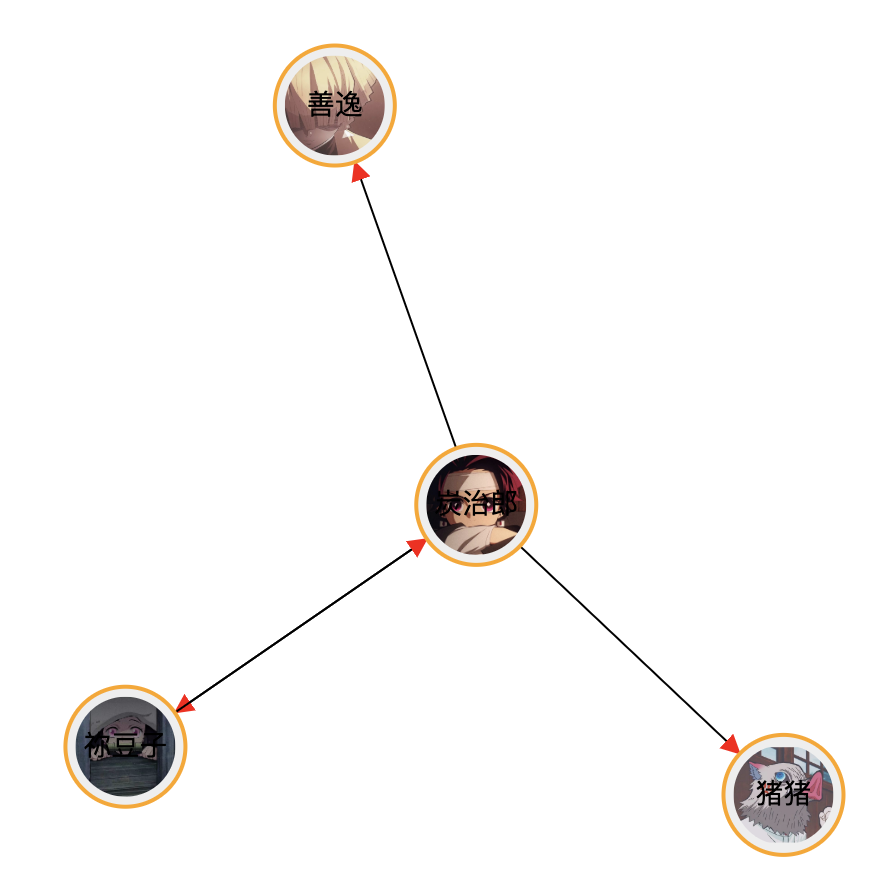
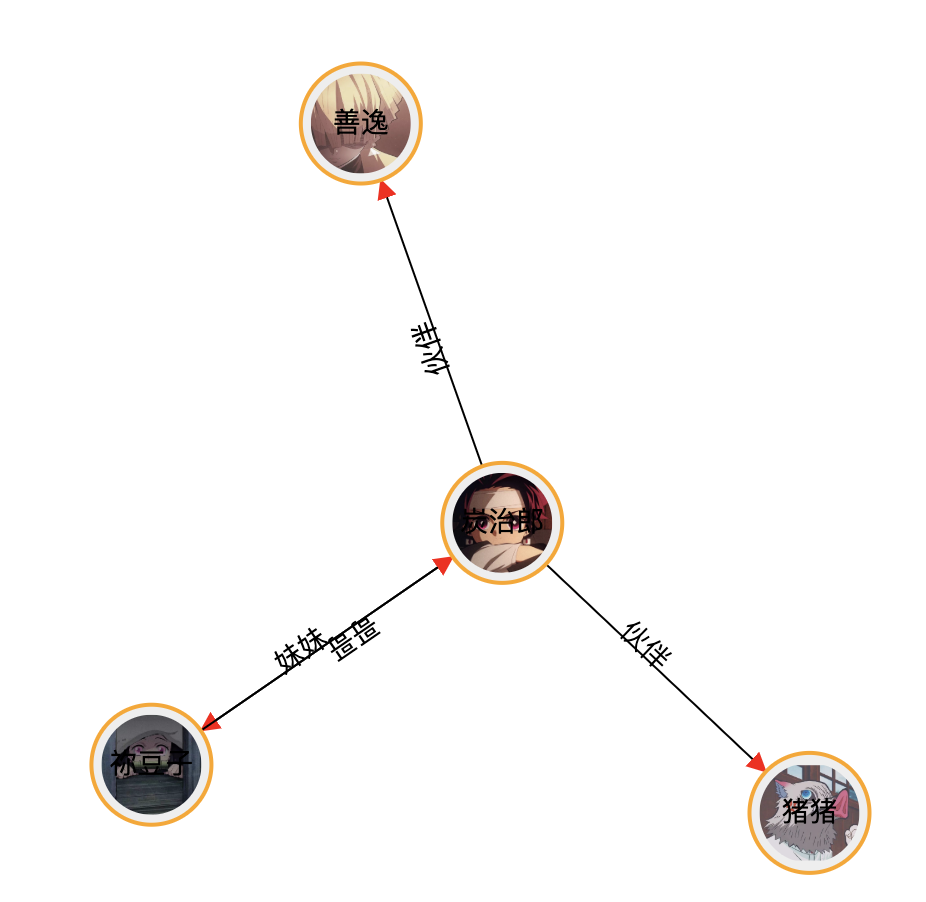
const nodes = [{
        id: 1,
        name: "炭治郎",
        src: tanImg
    },
    {
        id: 2,
        name: "祢豆子",
        src: neImg
    },
    {
        id: 3,
        name: "善逸",
        src: sanImg
    },
    {
        id: 4,
        name: "猪猪",
        src: inoImg
    }
];
const edges = [{
        id: 1,
        source: 1,
        target: 2,
        tag: "哥哥"
    },
    {
        id: 2,
        source: 1,
        target: 3,
        tag: "伙伴"
    },
    {
        id: 3,
        source: 1,
        target: 4,
        tag: "伙伴"
    },
    {
        id: 4,
        source: 2,
        target: 1,
        tag: "妹妹"
    }
];
图片的地址数据请自行替换。
添加图片
在circle节点上添加图片
const nodeImage = svg
    .select("g")
    .selectAll("image")
    .data(nodes)
    .enter()
    .append("image")
    .attr("xlink:href", d => d.src)
    .attr("x", -25)
    .attr("y", -25)
    .attr("width", 50)
    .attr("height", 50);
同理调整节点位置
simulation.on("tick", () => {
      ...

*      nodeImage.attr("transform", d => {
*        return d && "translate(" + d.x + "," + d.y + ")";
*      });

      ...
    });
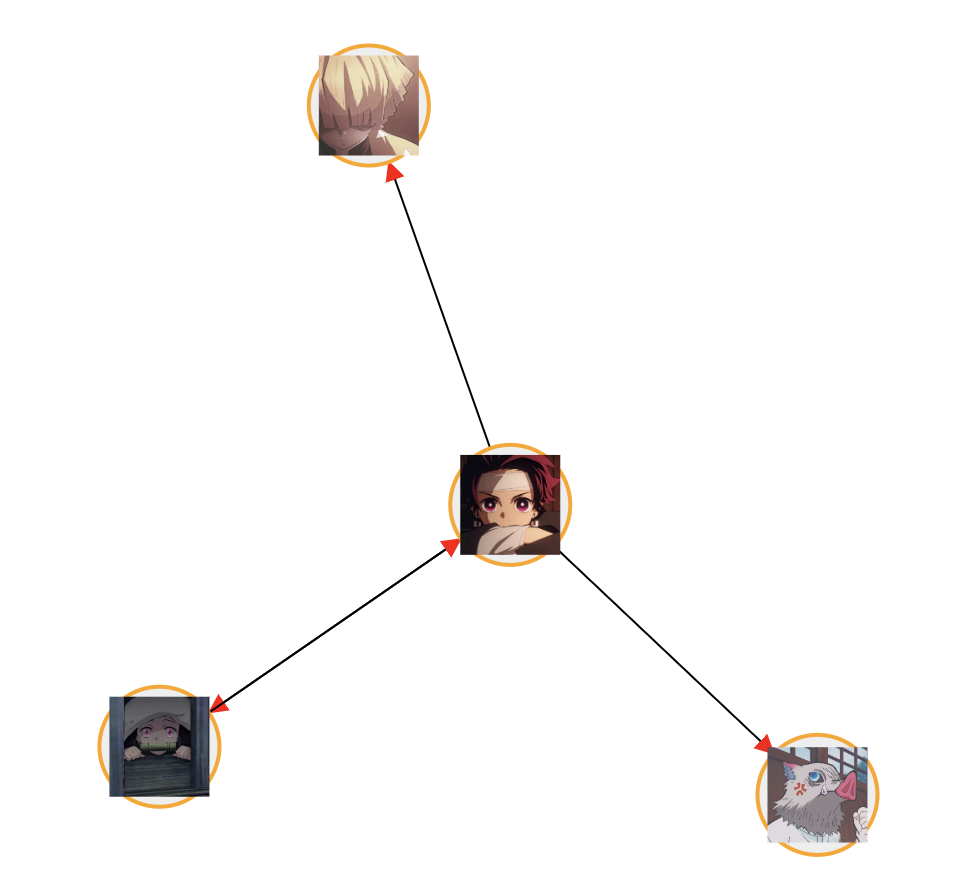
将图片调整为圆形
还记得刚才说的defs吗?我们在这里添加一个路径裁剪元素。
const round = defs
    .append("clipPath")
    .attr("id", "avatar-clip")
    .append("circle")
    .attr("cx", 0)
    .attr("cy", 0)
    .attr("r", 25);
const nodeImage = svg
      .select("g")
      .selectAll("image")
      .data(nodes)
      .enter()
      .append("image")
      .attr("xlink:href", d => d.src)
      .attr("x", -25)
      .attr("y", -25)
      .attr("width", 50)
      .attr("height", 50)

*     .attr("clip-path", "url(#avatar-clip)");
为边线添加文字
const edgeText = svg
    .select("g")
    .selectAll(".edgelabel")
    .data(edges)
    .enter()
    .append("text")
    .attr("class", "edgelabel")
    .attr("dx", 80)
    .attr("dy", 0);
edgeText
    .append("textPath")
    .attr("xlink:href", (d, i) => {
        return "#edgepath" + i;
    })
    .text(d => {
        return d && d.tag;
    });
注意代码位置,如果放在之前写的nodeText前面,会导致节点文字不显示的问题。这个问题之后讨论。
为节点添加拖拽
const nodeImage = svg
      .select("g")
      .selectAll("image")
      .data(nodes)
      .enter()
      .append("image")
      .attr("xlink:href", d => d.src)
      .attr("x", -25)
      .attr("y", -25)
      .attr("width", 50)
      .attr("height", 50)
      .attr("clip-path", "url(#avatar-clip)")

*     .call(drag);
function onDragStart(d) {
    if (!d3.event.active) {
        simulation.alphaTarget(1).restart();
    }
}

function dragging(d) {
    d.fx = d3.event.x;
    d.fy = d3.event.y;
}

function onDragEnd(d) {}

const drag = d3
    .drag()
    .on("start", onDragStart)
    .on("drag", dragging)
    .on("end", onDragEnd);
添加节点悬浮标题
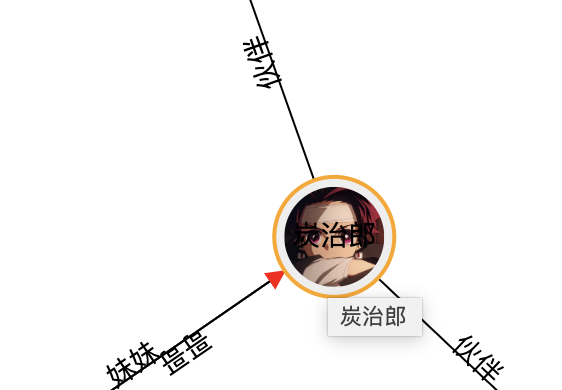
nodeImage.append("title").text(d => d.name);
其他交互
当鼠标滑到某个图片上时,当前节点及其关联节点样式不变,其他不想关节点透明度降低。
这个交互是关系图普遍的操作。
在添加代码前,我们先把图片上的文字隐藏,一是碍眼,二是影响鼠标悬浮图片的判断。
nodeImage.on("mouseover", d => {
        nodeImage.style("opacity", o => {
            return isConnected(d, o) ? 1 : 0.3;
        });

        nodeCircle.style("opacity", o => {
    return isConnected(d, o) ? 1 : 0.3;
});

        edgeLine.style("stroke-opacity", o => {
            return o.source === d || o.target === d ? 1 : 0.3;
        });
        edgeLine.style("stroke", o => {
            return o.source === d || o.target === d ? "#333" : "#000";
        });
    })
    .on("mouseout", d => {
        nodeImage.style("opacity", 1);
        nodeCircle.style("opacity", 1);
        edgeLine.style("stroke-opacity", 1);
        edgeLine.style("stroke", "#000");
    });
 var linkedByIndex = {};
 edges.forEach(d => {
     linkedByIndex[d.source.index + "," + d.target.index] = 1;
 });

 function isConnected(a, b) {
     return (
         linkedByIndex[a.index + "," + b.index] ||
         linkedByIndex[b.index + "," + a.index] ||
         a.index === b.index
     );
 }
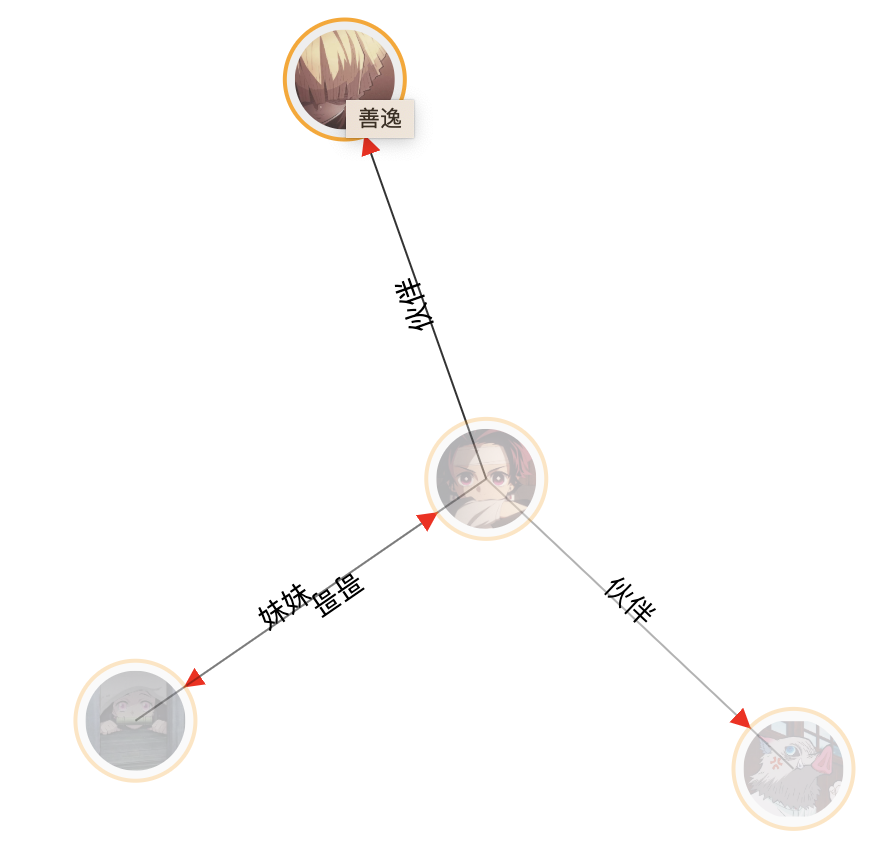 我们看到,设置透明度后,底部的线都显示出来了,这不是我们想要的效果,所以我们需要把下面这段代码注释
nodeCircle.style("opacity", o => {
    return isConnected(d, o) ? 1 : 0.3;
});
是鼠标滑上去时只有图片透明度改变,底部的圆不变,这样线就不会因为透明度露出来了。
小结
整体的流程算走完了,基本模拟出了关系图的效果。然而d3的api和svg等知识点太多,需要慢慢梳理学习,代码的细节和页面的效果也有待优化。现在的代码看起来就是一大坨搅在一起,需要把功能点细分到每一个函数。页面也需更注重用户体验,比如刚才说的透明度底部细线的问题。